Fundamental Analysis of Bitcoin and Ethereum
- Xelene Aguiar
- Nov 1, 2021
- 9 min read

Updated: Sep 5, 2025
This note is an attempt to introduce the reader to key metrics used in a fundamental analysis of the Bitcoin and Ethereum network. Global data available for these metrics have also been captured in this note.This note is NOT INVESTMENT ADVICE. Nor does this note suggest predictions on the future price of Bitcoin and Ether. The reader is advised to make her own interpretation of the metrics shown here.
Introduction
Fundamental analysis is carried out when a potential investor attempts to determine the 'true' value of an asset. Investors assume that an asset may gravitate towards its fair market value over time, and if the result of the fundamental analysis is different from the current market price, then there is a trading opportunity.Bitcoin and other assets (like gold and silver) that don’t generate cash flows cannot be valued based on future cash flows. Cryptocurrency networks can't really be assessed through the same lens as traditional businesses. The more decentralized offerings like Bitcoin (BTC) are closer to commodities. Even with more centralized cryptocurrencies (such as those issued by organizations), traditional FA indicators provide limited insight.
So, how do we ‘value’ a cryptocurrency?
For cryptocurrencies, we need to rely on alternative criteria: tokenomics, developer activity, target market, competitors, etc. However, it remains difficult to translate these factors into 'cash flows' to arrive at a true price. Given the immaturity and volatility of the industry, prediction is especially challenging.
Instead, this note focuses on on-chain metrics—those that cannot be easily manipulated. Social media metrics (Twitter, Telegram, Reddit) are excluded as they can be gamed.
Bitcoin Halving
One significant characteristic of Bitcoin is that after every 210,000 blocks the block reward is halved. Empirical data shows that price cycles often appear to follow this ~4-year halving schedule. However, correlation should not be mistaken for causation: global liquidity conditions, regulation, and macroeconomic trends also strongly influence price.
Ethereum and Ether
Ethereum is a decentralized platform that allows digital transfer of value and also enables developers to deploy and interact with decentralized applications (dApps). The flexibility of Ethereum permits the support of sophisticated smart contracts. The primary goal of Ethereum is to allow developers to create and launch codes which run across a distributed network and aren't stored or hosted on a central server. This theoretically allows for these applications to run and not be shut down or censored indefinitely.
The unit of value used on the Ethereum protocol is Ether (ETH). In this note, Ether refers to the coin and Ethereum refers to the network.
Key Indicators in the Fundamental analysis of Bitcoin and Ethereum
Price trends/ cycles
Although price trends cannot reliably predict the future price of a cryptocurrency, they can offer some insight into possible directions of price movement.
BitcoinBitcoin witnessed its first big price jump in 2010 when it rose from a fraction of a penny to $0.08. Since then, its price has increased, though not in a ‘steady’ fashion. Bitcoin is one of the most volatile asset classes in existence and has experienced numerous price ‘crashes’ in its short history. The early volatility was primarily driven by speculative trading by retail investors. Over time, with its growing reputation as a potential store of value and hedge against inflation, Bitcoin also attracted increased participation from institutional investors.

A look at the price chart (see Figure 1) shows recurring U-shaped cycles that often appear close to the Bitcoin ‘halving’ schedule. Halvings occurred in November 2012, July 2016, and May 2020, and each took place near the trough of a cycle. These periods were typically followed by new all-time highs. However, correlation does not imply causation. While halving may influence supply dynamics, other factors such as global liquidity conditions, regulation, and macroeconomic trends also strongly affect Bitcoin’s price.
Ether
There is a common opinion that Bitcoin’s price movements drive the price of most other cryptocurrencies. Correlation data between 2018 and 2020 is sometimes used to support this view (see Figure 2). Normally, when comparing the correlation between two items, a Pearson correlation coefficient between 0.7 and 1.0 indicates a strong positive correlation; in other words, values in this range suggest a high likelihood of a meaningful relationship between the two. However, correlation does not imply causation—Bitcoin and Ether may move together during certain market phases without one directly driving the other. For example, during Ethereum’s “Merge” upgrade in 2022, Ether’s price dynamics were strongly influenced by the protocol change, while Bitcoin followed its own trajectory, showing that independent factors can dominate. Moreover, this relationship is not consistent across all periods. Independent factors—such as upgrades to the Ethereum protocol, developer activity, or application usage—can affect the price of Ether without necessarily impacting Bitcoin.

Price and Active Address
“Active addresses” are blockchain addresses that record transactions during a given period of time. Most cryptocurrency addresses are pseudonymous since no personally identifiable information is required when setting up a wallet. However, they are not completely anonymous—some addresses are publicly known to belong to specific individuals or institutions.
Conceptually, a rise in active addresses often suggests increased interest in a cryptocurrency and potentially greater capital inflow, which can support higher prices (and vice versa). While not reliable as a standalone indicator—since the metric can be artificially inflated—active address data can nonetheless reveal useful insights about network activity.
Bitcoin
A trend plot of Bitcoin price and active addresses (Figure 3) shows that, historically, active addresses and price have often tracked each other. Scatter plots (See gallery) illustrate a generally positive correlation between the two.


However, this correlation has weakened over time. During the 2009–2012 period (first halving cycle), the correlation was ~0.76, but it fell to ~0.5 between 2017 and 2020, and by 2021 had declined to ~0.1. This suggests that the number of people transacting on the Bitcoin network has a smaller direct influence on price than it once did. Other factors—such as institutional adoption, derivatives markets, and macroeconomic conditions—now play a much larger role. Put differently: when Bitcoin’s price was relatively low and adoption still nascent, usage activity (active addresses) tracked closely with price; as the asset matured, price became increasingly driven by external factors.
Ether
A similar trend is seen between the price of Ether and active addresses (See Gallery below). Until around 2019, there was a very strong correlation between the two. However, more recent data shows almost no correlation.


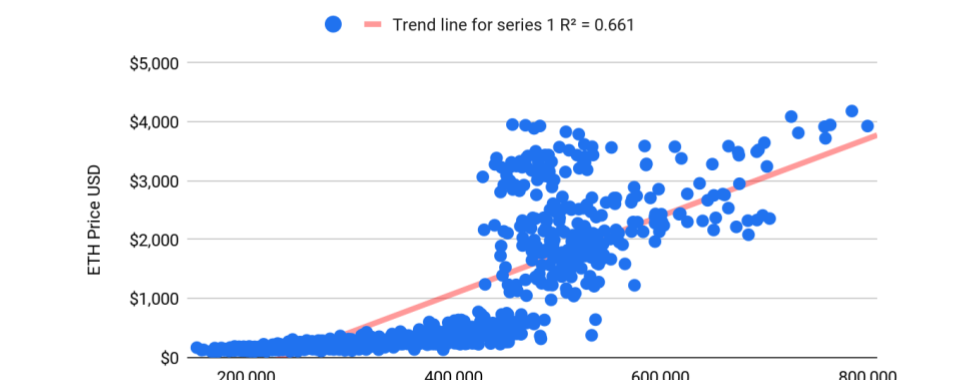
This indicates that, at present, the number of people transacting in Ether has limited direct impact on its price. Instead, other factors—such as staking, DeFi usage, and network upgrades—can drive Ether’s value independently of active address counts.
Price and Transaction Count
Transaction count is a useful measure of network activity. Similar to active addresses, a higher number of transactions suggests more participation and interest in the network, which in theory could support higher prices. However, in practice, this relationship weakens once networks hit technical limits.
Bitcoin
A trend plot of Bitcoin price and daily transaction count (Figure 11) shows that, in the early years, daily transactions and price generally tracked each other. However, since around 2016, daily transaction counts have stabilized even as Bitcoin’s price has continued to rise.


This divergence can be attributed to Bitcoin’s scalability limitations. The network’s capacity is capped by its transaction-per-second (tps) rate—roughly 4–7 tps under normal conditions, depending on block size and SegWit adoption. This translates to an upper bound of about 350,000–600,000 transactions per day (see Figure 12). As a result, daily transaction counts have plateaued, meaning they no longer serve as a reliable leading indicator of price movements.
That said, Layer-2 solutions such as the Lightning Network have emerged to process transactions off-chain while settling final states on the Bitcoin base chain. These scaling layers increase effective throughput, but their usage is not reflected in the base-chain transaction count. This further weakens the direct correlation between on-chain activity and Bitcoin’s price.
Ether
Ethereum processes transactions at a higher baseline rate than Bitcoin (around 13–15 tps on the base layer). However, demand has often exceeded this capacity. Pending transaction charts regularly show congestion, especially during peak DeFi or NFT activity (see Etherscan). In practice, Ethereum’s maximum observed daily throughput has been around 1.1–1.3 million transactions per day (Figures 13 and 14).


As with Bitcoin, raw transaction counts have plateaued at network capacity. The difference is that Ethereum has aggressively adopted scaling solutions: Layer-2 rollups (e.g., Arbitrum, Optimism, zkSync) and other off-chain systems handle a growing share of activity. These do not fully show up in base-layer transaction metrics but still contribute significantly to Ethereum’s utility and valuation.
Market Value to Realized Value (MVRV)
Realized capitalization is a metric introduced by Coin Metrics that values each unit of an asset at the price it last moved on-chain (i.e., the last time it was transacted). This contrasts with traditional market capitalization, which values every unit of supply uniformly at the current market price.
Formula:MVRV = Market Value ÷ Realized Value
MVRV is widely regarded as one of the more reliable valuation metrics for blockchain networks. It provides insight into whether a coin is relatively overvalued or undervalued, and can help identify market tops and bottoms as well as investor behavior.
High MVRV (>3.7):Suggests high unrealized profits in the market, which often increases the risk of profit-taking. Historically, this level has aligned with cycle tops and subsequent price corrections.
MVRV closer to 1 (≈1.1 to 3.1):Indicates lower risk of profit-taking and is often associated with neutral to moderately bullish phases.
MVRV = 1:The market is considered “fairly valued.” On average, investors are holding coins at their cost basis, making them more likely to “HODL” rather than sell.
Low MVRV (<1):Implies the market is undervalued, as coins are trading below their realized value. Historically, such phases have preceded recoveries and upward price pressure.
Bitcoin
The MVRV and price plot for Bitcoin (Figure 15) shows that MVRV has successfully signaled multiple market tops. Peaks in April 2013, November 2013, December 2017, and February 2021 all coincided with MVRV levels above 3.7, followed by periods of profit-taking.

Ether
Ether’s MVRV (Figure 16) has historically been more subdued compared to Bitcoin. This could suggest that Ether’s valuation cycles are less extreme, or that its investor base behaves differently. A key factor here is staking: with Ethereum’s shift to proof-of-stake, a large share of Ether is now locked in validator contracts. These coins do not “move” on-chain for long periods, which lowers realized turnover and dampens the volatility of MVRV readings. As a result, Ether’s MVRV may systematically appear less extreme than Bitcoin’s, even during strong market cycles.

Network Value to Transaction Ratio (NVT)
The Network Value to Transaction ratio (NVT) is calculated by dividing a coin’s market capitalization by its daily on-chain transaction volume:
Formula:NVT = Market Cap ÷ Daily Transaction Volume
The metric was first introduced by Willy Woo in February 2017 and is often described as Bitcoin’s equivalent of the price-to-earnings (P/E) ratio in equity markets. The idea is that the more transaction volume flowing through a network, the more “utility value” it provides, with volume acting as a proxy for earnings.
NVT helps distinguish between organic network value and speculative excess. If market capitalization grows much faster than transaction volume, it suggests the asset may be overvalued relative to actual usage. Conversely, lower NVT values imply healthier alignment between valuation and network activity.
High NVT (above ~90–95):Indicates elevated speculative value relative to network usage, often associated with bubble-like conditions.
Moderate NVT:Suggests a balanced relationship between price and underlying transaction activity.
Low NVT:May indicate undervaluation or periods when the market is pricing the asset more conservatively relative to usage.
Bitcoin and Ether
NVT trends for Bitcoin and Ether are shown below. Historically, Bitcoin has exhibited periodic spikes in NVT, often coinciding with overheated markets, followed by corrections. Ether’s NVT has also fluctuated, though interpretation is complicated by its multi-purpose network usage (e.g., DeFi, NFTs, staking). These use cases may drive transaction volume that does not always map cleanly to speculative cycles, meaning Ether’s NVT can behave differently from Bitcoin’s.


Conclusion
The search for “fundamentals” in Bitcoin and Ether is still very much a work in progress. Unlike traditional assets, there is no earnings report or dividend stream to anchor their value, so researchers and investors turn to network metrics as a way of taking the pulse. Active addresses, transaction counts, MVRV, and NVT all highlight important aspects of adoption and sentiment—but none of them tell the full story on their own.
What makes this space exciting is how quickly the research is evolving. New approaches are being tested, from on-chain analysis of wallet cohorts (long-term holders vs. short-term traders), to liquidity and order-book depth metrics, to Ethereum-specific indicators such as gas fees, staking flows, and activity across DeFi and NFT ecosystems. There is also growing academic work on “crypto fundamentals” that borrows tools from network theory, behavioral economics, and even ecology to better explain the cycles we observe.
For now, the best way to approach Bitcoin and Ether is to see these metrics not as prediction tools, but as windows into how the networks are being used and how communities around them are behaving. As the industry matures, the hope is that these insights will become more robust, helping us move closer to a true science of crypto fundamentals.

Comments